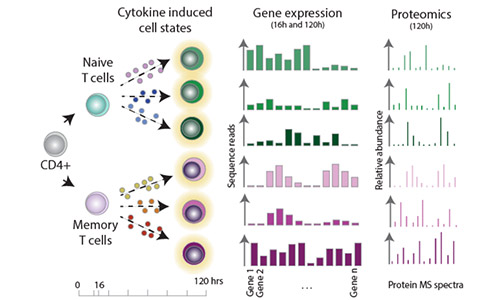
 Figure 1.A. - Overview of the experimental design
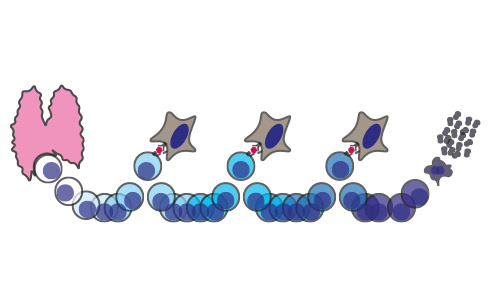
 Figure 1.B. - Graphical representation of conclusion of paper
This page contains the data generated in the study "Single-cell transcriptomics identifies an effectorness gradient shaping the response of CD4+ T cells to cytokines". For a detailed explanation of the study and the approaches for data generation, please refer to our publication:
Count tables
- Bulk RNA-sequencing: Raw counts per gene per sample obtained from RNA-sequencing and feature quantification (i.e. STAR and featureCounts)
- Quantitative proteomics: Relative protein abundances per gene per sample as inferred from mass spectrometry (LC-MS/MS)
- Single-cell RNA-sequencing: UMI counts per gene per cell obtained scRNA-seq (10X 3’ v2) and feature quantification (i.e. cellranger)
Data visualisations and interactive web applications
- Bulk RNA and protein expression: Shiny app to visualise RNA and protein expression levels for any gene across cytokine-polarized CD4+ T cell states
- Single-cell gene expression: Interactive apps to visualise single-cell RNA expression in:
- Alternatively, download the coordinates for every lower dimensional representation (UMAP, tSNE and PCA) of our single-cell data and analyse it locally: